
Detecting Network Microbursts with WhiteOwl Networks Packet Probe
Microbursts are one of the most frustrating and least understood causes of network performance problems. They can introduce packet loss, latency, and jitter — even when average utilization looks perfectly healthy.
Traditional flow monitoring, with 1-minute or 5-minute aggregation windows, simply isn’t designed to see these events.
WhiteOwl Networks changes that.
What Are Microbursts?
A microburst is a short, intense spike in traffic that occurs over milliseconds rather than seconds or minutes. These bursts can overflow switch buffers and cause drops long before traditional monitoring tools notice anything unusual.
From a dashboard perspective:
- Average utilization looks fine
- Interfaces are not “maxed out”
- Users still experience poor performance
The problem is visibility — not capacity.
A good detailed article here –
https://dl.ifip.org/db/conf/cnsm/cnsm2024/1571039708.pdf
Why Traditional Flow Monitoring Misses Microbursts
Classic flow analytics summarize traffic over long intervals. While this works for capacity planning, it completely hides sub-second behavior.
For example, consider a 5-second flow that transfers 500 KB:
- Average rate: 100 KB/s — nothing alarming
- But within that flow, there may be a single 10ms window where 150 KB was transmitted
That’s an instantaneous rate of 15 MB/s, more than enough to cause buffer pressure on a busy link.
How WhiteOwl Detects Microbursts
WhiteOwl introduces microburst detection by analyzing traffic at 10ms granularity directly at the probe.
Probe-Side Burst Tracking
For each flow, the WhiteOwl probe tracks traffic intensity using sliding 10ms windows and records:
- max_bytes_per_window
The highest number of bytes seen in any single 10ms window - max_packets_per_window
The highest packet count observed in a 10ms window
Only the peak values are stored, keeping overhead low while preserving the most important signal.
https://whiteowlnetworks.com/docs/Packet_Probe/micro-burst
Why 10ms Windows?
The 10ms window size was chosen intentionally:
- Switch buffers typically fill and drain in the 1–50ms range
- TCP congestion behavior reacts at RTT-scale intervals
- Operational practicality — fine enough to catch real problems without excessive cost
This allows WhiteOwl to surface bursts that actually impact application performance.
Making Bursts Actionable: The Burst Ratio
Raw burst size is useful, but context matters. WhiteOwl calculates a burst ratio to normalize behavior across different flows and links:
Burst Ratio = Peak Window Bytes / Average Window Bytes
Interpreting Burst Ratios
- 1–2: Smooth, well-paced traffic
- 2–5: Mildly bursty (common for web traffic)
- 5–20: Bursty, may cause issues on congested links
- 20+: Highly bursty — investigate immediately
This makes it easy to identify traffic patterns that are disproportionately aggressive.
Visualizing Microbursts in WhiteOwl
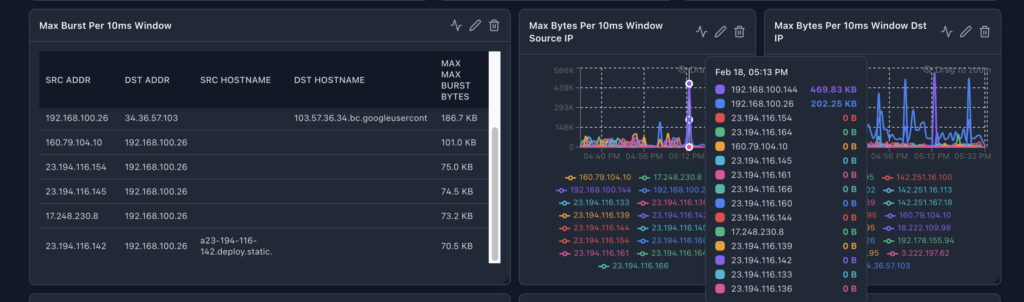
Using the WhiteOwl packet probe to generate the flow data microburst metrics are fully integrated into the WhiteOwl UI and can be visualized using:
- Bar charts to identify top bursty sources or applications
- Time series to understand when bursts occur
- Tables for detailed flow-level analysis
Recommended groupings include:
- Source or destination IP
- Application or destination port
- Autonomous system or network segment
This allows operators to quickly answer:
- Who is generating bursts?
- What application is responsible?
- When the bursts occur?
Common Causes of Microbursts
WhiteOwl commonly identifies microbursts caused by:
- TCP slow start on new connections
- Backup jobs without rate limiting
- Incast scenarios in distributed systems
- Chunk-based video delivery
- Poorly implemented application send loops
These issues are often invisible without sub-second visibility.
Why This Matters
Microbursts don’t need to be constant to be damaging. A single burst can trigger packet loss, retransmissions, and cascading latency.
By exposing burst behavior directly in flow telemetry, WhiteOwl Networks enables teams to:
- Detect hidden performance risks
- Identify problematic applications and hosts
- Take action before users feel the impact
This is network observability at the timescale where problems actually occur.