
Why Enterprise Network Teams Are Switching from SolarWinds to WhiteOwl Networks
WhiteOwl is a SolarWinds alternative for network monitoring. For years, SolarWinds has been the default choice for enterprise network monitoring. But default doesn’t mean best — and for a growing number of network engineers and IT directors, the combination of SolarWinds’ complexity, licensing costs, and bloated architecture is pushing them to look for something better.
WhiteOwl Networks was built specifically to address these pain points. Designed by engineers with decades of hands-on experience in carrier-grade networking, it delivers the visibility enterprise teams need without the overhead they don’t. Here’s a head-to-head look at how the two platforms compare across the features that matter most.
Flow Visibility: Real Intelligence vs. Basic Reporting
SolarWinds NetFlow Traffic Analyzer provides flow collection and basic top-talker reports, but it has real limitations when you start asking deeper questions. Getting from a high-level traffic summary down to individual flows requires navigating multiple screens, and the correlation between flow data and other monitoring data is often manual work.
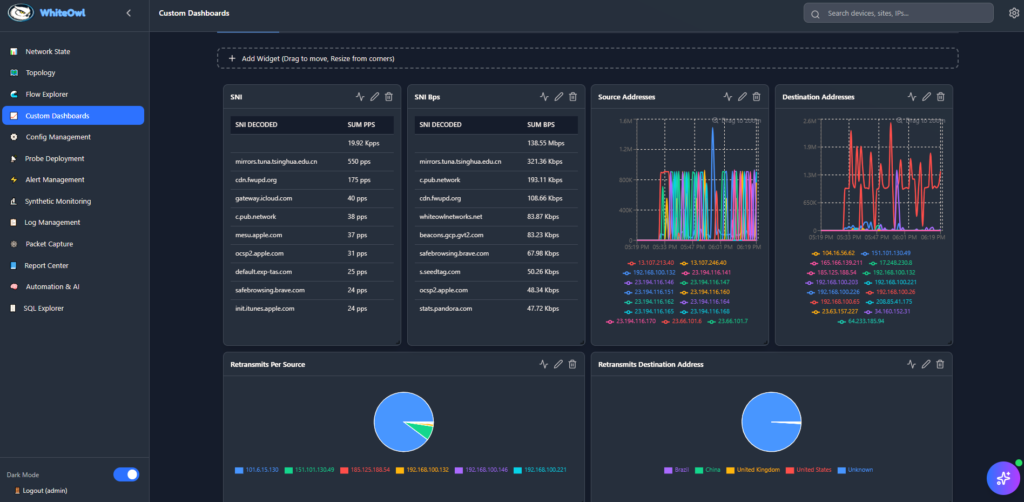
WhiteOwl takes a fundamentally different approach. Flow data is stored in ClickHouse — one of the fastest analytical databases available — enabling real-time queries across hundreds of millions of flow records in seconds. The Flow Explorer lets engineers drill from network-wide summaries down to individual 5-tuple flows instantly, with full support for filtering by application protocol, SNI hostname, geographic region, VLAN, and VXLAN. Deep Packet Inspection via nDPI gives you application-layer visibility without deploying separate probes for every site.
The WhiteOwl probe captures packets and converts them to enriched flow data with TCP performance metrics, microburst detection, and SNI decoding — data that SolarWinds NTA simply doesn’t provide out of the box.
Bottom line: WhiteOwl provides deeper flow intelligence with faster query performance and richer application-layer context.
SNMP Visibility: Discovery That Actually Works
SolarWinds NPM has long been the gold standard for SNMP monitoring, and it does the basics well. But getting a complete topology view often requires significant manual configuration, and keeping it current as the network changes is an ongoing maintenance burden. Licensing is also per-node, which means costs escalate quickly as you add devices.
WhiteOwl combines SNMP polling with LLDP-based topology discovery to automatically build and maintain a live network topology map. The topology view links directly to flow data — click any device or link in the topology and immediately see the top flows traversing it. Vendor-specific SNMP handlers for Cisco, Juniper, Arista, and other major vendors ensure accurate data collection without manual MIB configuration.
SNMP metrics feed directly into the alerting engine with baseline deviation detection, so you get alerted when something is genuinely abnormal — not just when it crosses an arbitrary static threshold.
Bottom line: WhiteOwl combines topology, SNMP metrics, and flow data in a single correlated view that SolarWinds requires multiple products to achieve.
Log Management: Integrated, Not Bolted On
SolarWinds Log Analyzer is a separate licensed product. Correlating log data with network performance data requires jumping between interfaces, and the licensing cost adds up quickly when you factor in log volume.
WhiteOwl includes log collection and visualization natively. Device logs are ingested, filtered, and surfaced directly in custom dashboards alongside flow and SNMP data. Engineers can build dashboards that combine a bandwidth graph, SNMP CPU utilization, and relevant syslog events in a single view — giving context that isolated tools can never provide.
This integration is particularly powerful during incident response. When an interface flaps, you want to see the SNMP error counters, the flow data showing what traffic was affected, and the syslog messages from the device — all in one place, correlated by time.
Bottom line: WhiteOwl delivers integrated log visibility without additional licensing or context-switching.
Synthetic Monitoring: Know Before Your Users Do
SolarWinds offers synthetic transaction monitoring through its Web Performance Monitor product — another separately licensed module. Basic ICMP and HTTP monitoring is available in NPM, but distributed synthetic testing from multiple vantage points requires additional infrastructure and cost.
WhiteOwl includes synthetic monitoring natively across all tiers. Run curl, ping, and DNS tests from the central server or from any deployed probe location, giving you a distributed view of reachability and performance from inside the network. Alerts trigger when response times or availability deviate from established baselines — catching degradation before end users notice.
The ability to run synthetics from probe locations is particularly valuable for enterprises with distributed WAN environments. Instead of relying on a single central vantage point, you get accurate performance data from the perspective of each site.
Bottom line: WhiteOwl includes distributed synthetic monitoring out of the box — no additional modules or licensing required.
Configuration Management: Ansible-Powered, Built In
SolarWinds NCM (Network Configuration Manager) is one of the more expensive add-on modules, with its own licensing tier. It provides configuration backup, change detection, and compliance reporting, but integration with the rest of the SolarWinds platform is limited.
WhiteOwl includes configuration management powered by Ansible playbooks, fully integrated into the platform. Collect device configurations on a schedule, detect changes, push configuration updates, and manage credentials securely — all from the same interface used for flow analysis and SNMP monitoring. Configuration data is stored and versioned, with change history available alongside the network performance data from the same time period.
The Ansible foundation means the configuration management capability is extensible. As your automation needs grow, you’re building on a widely adopted open standard rather than a proprietary system.
Bottom line: WhiteOwl delivers integrated, Ansible-based configuration management without the additional module cost.
The Real Difference: One Platform, One Price
SolarWinds is a collection of products — NPM, NTA, NCM, Log Analyzer, Web Performance Monitor — each with its own license, its own interface, and its own data silo. Getting a complete picture of your network requires purchasing and integrating multiple modules, and the total cost of ownership grows significantly once you add support contracts and per-node licensing.
WhiteOwl is a single platform. Flow visibility, SNMP polling, topology, logs, synthetics, configuration management, and AI-powered anomaly detection are all included in a flat annual license. There are no per-device fees, no module add-ons, and no surprises at renewal time.
For a 10-site enterprise network, the total cost of comparable SolarWinds functionality can easily run $50,000–$100,000 per year or more. WhiteOwl Professional starts at $19,995 per year — with everything included.
Who Should Make the Switch?
WhiteOwl is the right fit for enterprise network teams who:
- Are frustrated with SolarWinds’ complexity and the effort required to maintain it
- Are paying for multiple SolarWinds modules to get complete visibility
- Want deep packet-level and application-layer visibility without deploying additional tools
- Prefer self-hosted software with full control over their data
- Need a modern, fast UI that doesn’t require training to use effectively
If you’re ready to see what network monitoring looks like without the overhead, request a 30-day evaluation license and deploy WhiteOwl in your environment. Our installation script gets you running in under an hour.
WhiteOwl Networks is a self-hosted network observability platform built for enterprise IT teams. Learn more at whiteowlnetworks.com.