
WhiteOwl Network observability platform: all-in-one platform collects Netflow, IPFIX, sFlow, VPC flow logs, SNMP, device logs, device configurations, synthetic data and makes it explorable and actionable in an easy to use user interface operating on top of the fastest backend available.
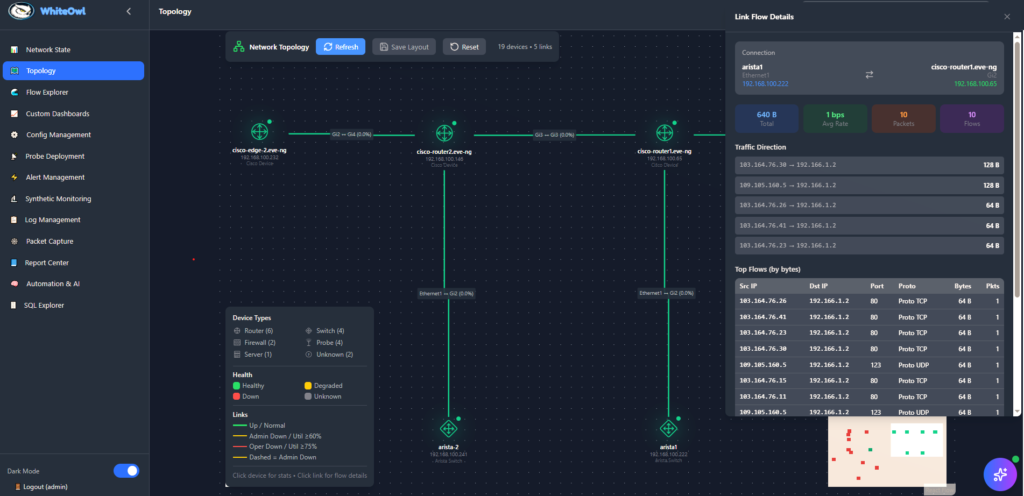
- Topology Powered by SNMP & Flow Data
- Automatically build a live network topology using SNMP and flow data that reflects how devices and links actually communicate.
- Visual, color-coded health indicators instantly show offline devices, high CPU, memory pressure, and link utilization.
- Drill down from topology to traffic by clicking any link to view the underlying flow data and traffic composition.
- Understand traffic paths at a glance and see who is talking to whom, across sites, segments, and applications.
- Quickly isolate performance issues by correlating device health metrics with real traffic flowing across the network.
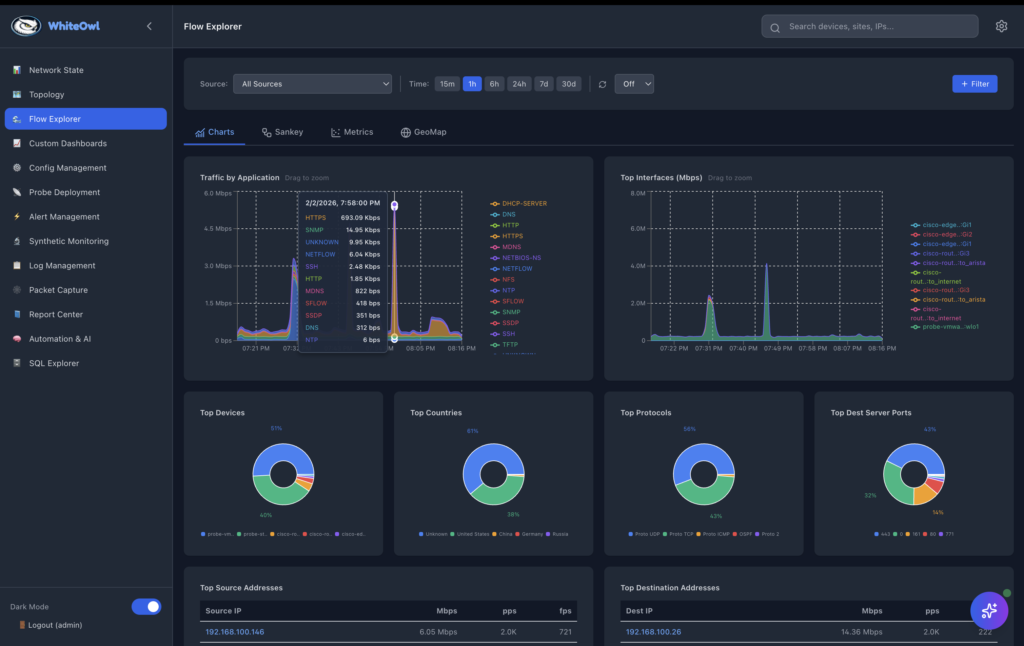
- Flow Analytics Dashboard with Context
- Visualize router, switch, firewall network traffic in real time
- Flows enriched with DNS context
- Geo-IP and ASN intelligence powered by MaxMind
- Tag and classify traffic
- Human-readable network context
- Filter by any dimension that matters
- Rapid traffic investigation
- Spot abnormal and unwanted traffic
- Historical and trending views
- Designed for operations and insight
- Deploy anywhere performance matters
- One probe, two roles
- Combines real packet capture with active performance testing in a single lightweight agent.
- Minimal footprint, deep visibility
- High-speed telemetry streaming
- Advanced TCP performance analytics
- Ideal for IoT environments
- Device-level intelligence
- Actionable insights, not just data
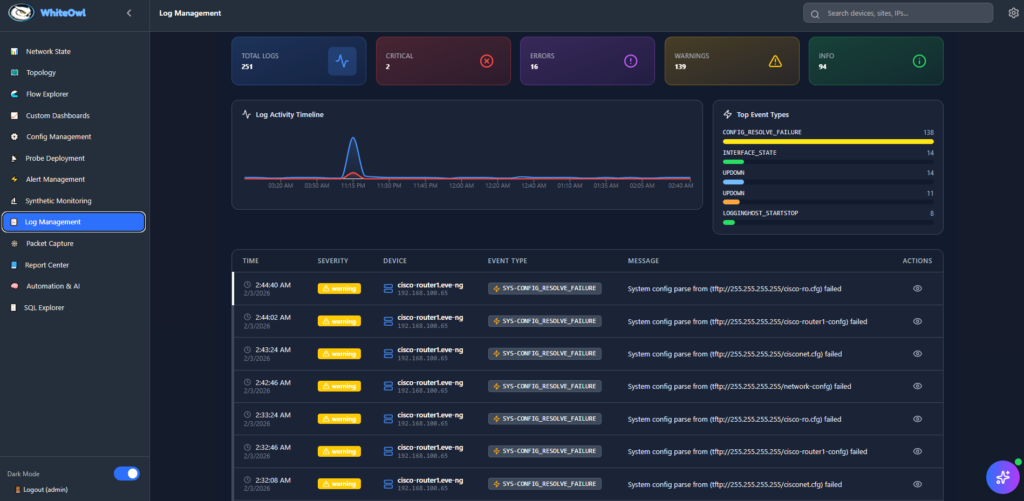
- Unified Log Visibility – Collect and centralize logs from routers, switches, firewalls, and other network devices in one searchable interface.
- Powerful Search & Filtering – Instantly filter by device, time range, severity, IP, or custom fields to find exactly what matters.
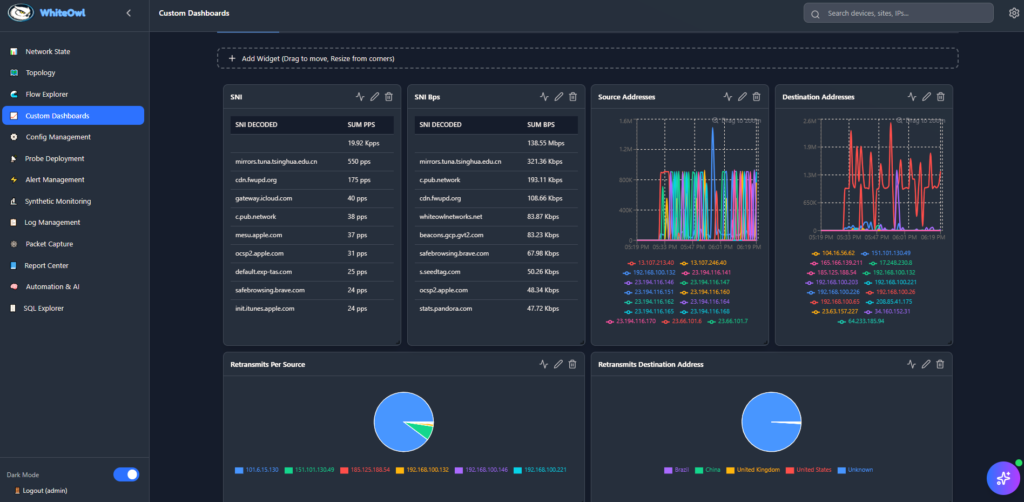
- Real-Time & Historical Insights
- Intuitive Visualizations
- Operational Efficiency
- Scalable & Vendor-Agnostic
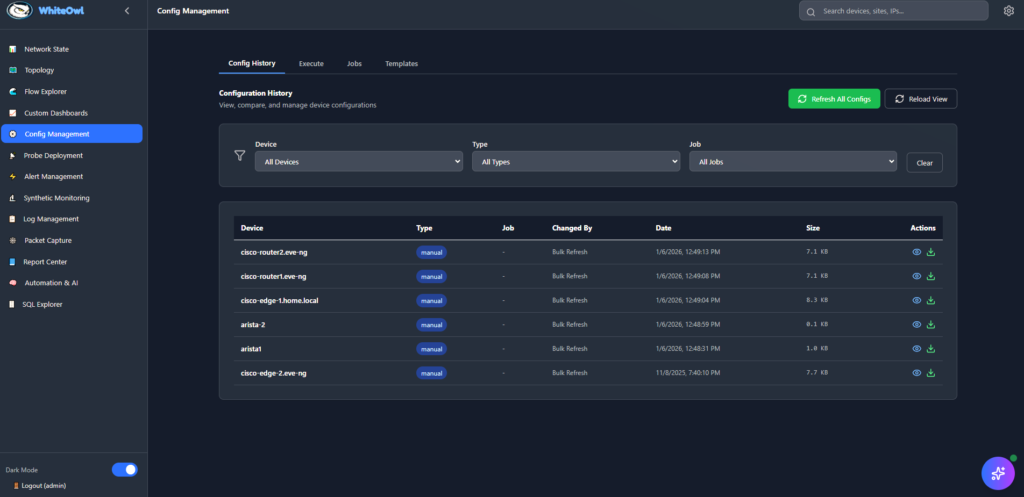
- Automated Configuration Collection – Use Ansible playbooks to reliably pull configurations from routers, switches, and firewalls.
- Template-Driven Standardization – Leverage Jinja2 templates to enforce consistent, repeatable configurations across devices.
- Centralized Config Repository
- Safe Configuration Deployment
- Drift Detection & Compliance
- Vendor-Agnostic Automation
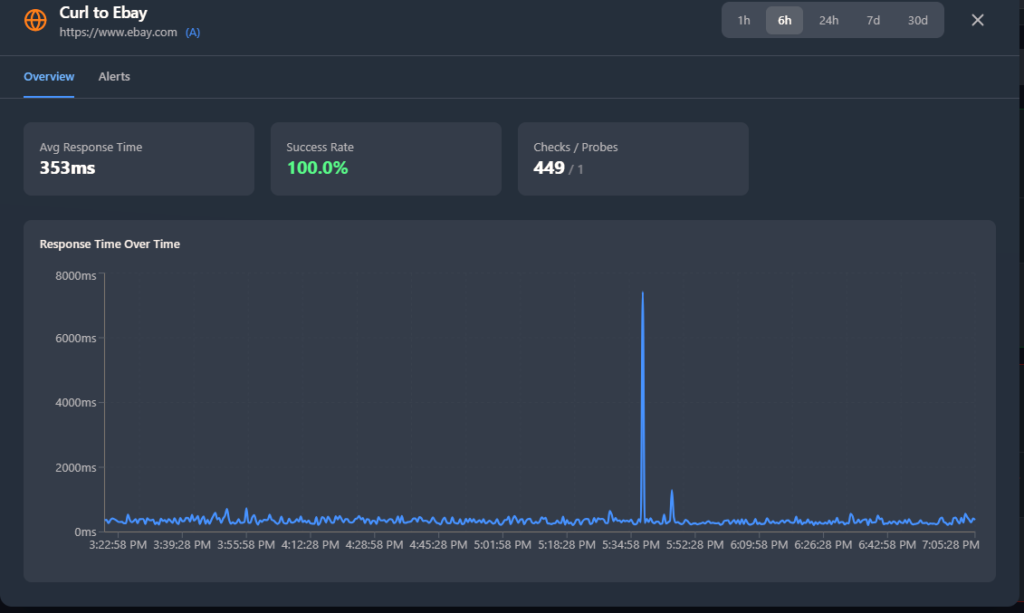
- Active Network & Service Probing – Continuously measure latency and availability using ping, traceroute, HTTP(S) curl, and DNS checks.
- Response Time Thresholds
- Real-Time Alerting – Generate alerts instantly when response times exceed configured limits or checks fail.
- Centralized Alert Dashboard
- Flexible Notification Channels – Send alerts via webhook, Slack, or syslog to integrate with existing workflows and tools
- Proactive Issue Detection – Identify performance degradation before it impacts users or downstream systems.
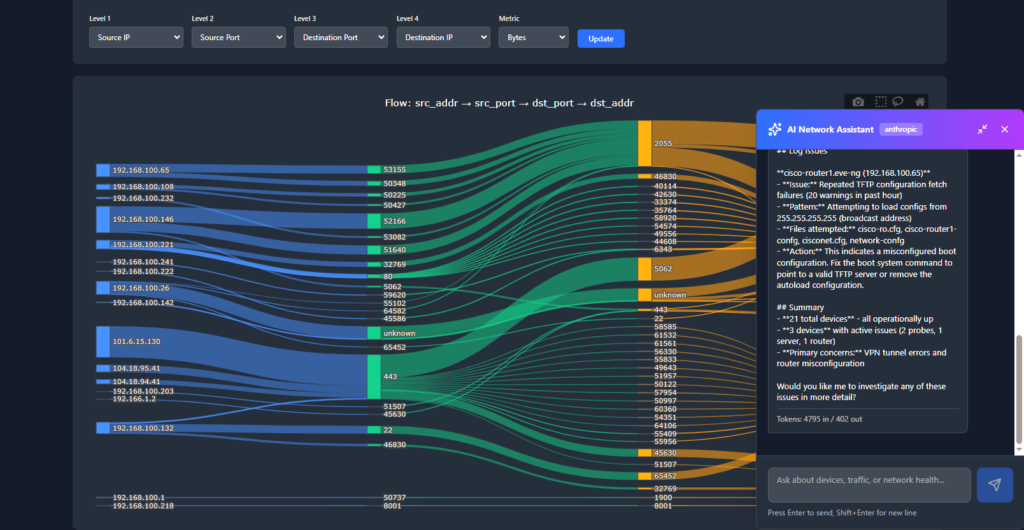
- Built-In AI Network Assistant – An AI agent helps operators analyze alerts, logs, and metrics to quickly determine what’s wrong.
- AI-Driven Alert Context
- Human-in-the-Loop by Design – AI features are fully optional and can be enabled or disabled per environment or team policy.
- Bring Your Own AI – Integrate your internal AI models or tools instead of the built-in agent.
- MCP Server Integration
- Operator-Focused Insights